

Nuclear Magnetic Resonance Spectroscopy
Note: Assumed knowledge or previous experience with NMR in High School or University.
This is perhaps one of the most important tools of chemistry, which involves an analyte absorbing energies from radiofrequencies. In particular, the absorption of radiofrequencies, is affected by the magnetic environment of the atomic nuclei in compounds. Thus it allows us to deduce structural information on the compound in question. It is typically used to determine the relative chemical environments of active atomic nuclei present in a compound, usually we analyse a solution of our analyte. Using a solution, we are also able to investigate the chemical behavior of the analyte.
We can take advantage of many different types of spectra depending on the atomic nuclei we want to analyse in a compound, the most commonly recorded spectra belongs to the Carbon-13 nuclei, in 13C NMR, usually used by organic chemists.
Suitable Nuclei
 |
| The three isotopes of hydrogen each have their own nuclei, which give their own NMR spectra. From left: Hydrogen, Deuterium and Tritium. Wikimedia source. |
All nuclei have a property called "nuclear spin," a quantized property which is described by the spin quantum number, I, with the corresponding numbers 0, 1/2, 1, 3/2, 5/2 and so on. When nuclei aren't exposed to a magnetic field, the spin states are considered degenerate, i.e. the spin states have all the same energy. Conversely, when a magnetic field is applied to a nuclei, it becomes "split," i.e. it becomes non-degenerate, and the spin states have different energy levels. Nuclei where the value of I, is equal to 0, they are said to be NMR inactive. On the other hand, for nuclei where I = 1/2, the nuclei is said to be NMR active, examples include 1H and 12C nuclei.
The 13C NMR spectra is important, because the carbon-13 isotope has a relative natural abundance of 1.1 %, so when investigating a compound, only 1% of all carbon atoms present in the compound will be the isotope. As a result, the relationship between 1H - 13C coupling has a consequence on the observed NMR spectra.
Given all of this, what constitutes a suitable nuclei? And what are some important factors that determine when an NMR spectra will be observed?
Given all of this, what constitutes a suitable nuclei? And what are some important factors that determine when an NMR spectra will be observed?
- The nuclear spin quantum number needs to be I ≥ 1/2;
- In general, it is advantageous for the particular nucleus to be in relative abundance, the 13C isotope is one exception, though. Abundance of a particular isotope (isotopic enrichment) can be utilized to enhance the signal : noise ratios;
- The nucleus must posses a relatively short spin-relaxation time (T1, given in seconds), which is dependent on the properties of the molecular environment and the nucleus itself;
- Finally, if I > 1/2, it results in a non-spherical distribution of nuclear charge, which is termed a quadrupole moment. This leads to relatively short values and causes the signals associated with the quadrupole moment to appear broad; signal broadening is also observed on nuclei attached to the nuclei that possesses a quadrupole moment. For example, 11B as well as an 1H NMR spectra of protons attached to 11B.
The importance of the T1 value becomes apparent when observing elements that have more than one NMR active form, for example 6Li and 7Li are both NMR active, but their values are different. Typically, 7Li has T1 < 3 s, while for 6Li is T1 ≈ 10 to 80 s. Considering the relative abundance of these isotopes, we find that 7Li has an abundance of 92.5%, which makes it more suitable than 6Li .
Chemical Shifts and Resonance Frequencies
You can read a table of frequencies at which you would be able to observe certain nuclei using NMR here. NMR spectrometers are calibrated to particular resonance frequencies which are specific to a nucleus (e.g. 1H, 13C, 11B, 35Cl, 37Cl absorb different radiofrequencies), for example a 400 MHz spectrometer set to 400 MHz, you will only be able to observe 1H nuclei; using the same 400 MHz spectrometer, but calibrated to 162 MHz, you would only be able to observe 31P.
1H NMR experiments involve identifying protons that are in different chemical environments (i.e. a H is bonded to different groups/atoms), which resonate at different frequencies.
The same is true for other types of NMR, which each give their own characteristic signals. Signals in an NMR spectrum are given a chemical shift value, 𝛿, which is relative to the specific radiofrequency of that nuclei. The chemical shift value is a parameter that is independent from the magnetic field applied to the analyte. It can be defined as:
 |
| For example, the proton NMR spectra of benzene (C6H6) only appears to have one peak. Why? Every 1H nuclei is bonded to the same 'environment' of a C=C bonded to another proton. |
The same is true for other types of NMR, which each give their own characteristic signals. Signals in an NMR spectrum are given a chemical shift value, 𝛿, which is relative to the specific radiofrequency of that nuclei. The chemical shift value is a parameter that is independent from the magnetic field applied to the analyte. It can be defined as:
𝛿 = (v - v0) / v0 = Δv / v0
The value of 𝛿 is usually quite small and inconvenient, so we usually multiply by 106, converting it into ppm (parts per million). The IUPAC convention for 𝛿, according to their Gold Book is defined as:
𝛿 = (v - v0) in Hz / v0 in MHz
For 1H and 13C NMR, the standard reference is tetramethylsilane, SiMe4. It is used as a reference for the shift, so to speak, of the signals from a particular nuclei from the reference signal. A positive 𝛿 is a shift to a higher frequency, while a negative shift (or less positive), means there is a shift to a lower frequency. This difference is the chemical shift.
Homonuclear spin-spin coupling
A nucleus can only occupy two spin states (-1/2 and +1/2), the energy difference between these spin states is dependent on the magnetic field produced by the NMR spectrometer. If say, there is a system where there are two magnetically non-equivalent 1H nuclei, there can only be situations (HA and HB) that can arise when a magnetic field is applied:
- The NMR signal for HA is split into two equal lines when a magnetic field is applied to HB, these equal lines are also produced by HB. The lines produced by are dependent on the which spin state of is "seen" by the spectrometer. These protons are said have coupled, producing two "doublets." The coupling constant, J, which is measured in Hz is defined as the splitting that occurs between two lines in each doublet.
- When no coupling of nuclei occurs. The local magnetic field produced by the spin of results in two resonances, each of these a singlet, as no coupling has occurred between the two nuclei.
Heteronuclear spin-spin coupling
Statistically, the 13C nuclei is quite rare. So in 1H NMR of say, acetone and assuming a natural distribution of carbon isotopes, you will not be able to observe the coupling of 1H - 13C. Conversely, You will observe this coupling when using 13C NMR spectrum on acetone, and will only observe a singlet because of the C=O group, and a quartet because of the two chemically equivalent -CH3 groups. You can see this in this spectra here.
Ion-solution exchanges can be observed using NMR
The exchange of cations into solution occurs at slow enough speeds to be observed at the NMR spectroscopic timescale. We utilize the 17O isotope as a label: because it is NMR active, and because I = 5/2. From the signal ratio of 17O present in a naturally isotopic distribution of co-ordinated water (recall H2O can form weak bonds with ions), you can actually find the hydration value of a given ion-water complex. For example, the Cu2+ ion has been found to co-ordinate (bond) with six water molecules, forming the complex ion [Cu(OH2)]2+ (hexaaquacopper(II)), forming an octahedral complex. See model below:
-3D-balls.png) |
| Hexaaquacopper(II), has six water molecules whose hydration number using 17O can be observed. |
Another exchange process are redistribution reactions, in which, substituents (chemical groups) are exchanged between chemical species - but - the types of bonds and number of bonds remain. Similar to a substitution reaction. For example, the reaction of Triethyl phosphite and Phosphorus trichloride:
We can find were the equilibrium lies using 31P spectroscopy, and the rate data by analysing the variation in the signal integrals (peaks), conversely, you can find the equilibrium constant (Kc) when no more variation is found in the signal integrals. Finding the equilibrium will allow you to find the all-important free energy change of the system (ΔGo = -RT ln K). Using this relationship you can then find the at varying temperatures using ΔGo = ΔHo - TΔSo. Thus, we can find the equilibrium position can be found in relation to temperature (remembering that ΔHo is almost 0, using the second law of thermodynamics), we can then differentiate to eventually find:
I won't go into how NMR machines work, but here's what they look like:
PCl3 + P(OEt)3 ⇌ PCl2(OEt) + PCl(OEt)2
We can find were the equilibrium lies using 31P spectroscopy, and the rate data by analysing the variation in the signal integrals (peaks), conversely, you can find the equilibrium constant (Kc) when no more variation is found in the signal integrals. Finding the equilibrium will allow you to find the all-important free energy change of the system (ΔGo = -RT ln K). Using this relationship you can then find the at varying temperatures using ΔGo = ΔHo - TΔSo. Thus, we can find the equilibrium position can be found in relation to temperature (remembering that ΔHo is almost 0, using the second law of thermodynamics), we can then differentiate to eventually find:
d ln K / dT = ΔHo/RT2
I won't go into how NMR machines work, but here's what they look like:
 |
| A Bruker NMR spectrometer connected to a computer. Wikimedia link. |
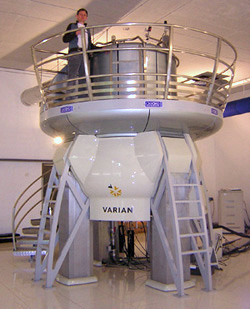 |
| A high-powered NMR machine from Varian, capable of using 900 MHz frequencies. |

 = 1/2
= 1/2
 IR and Raman spectroscopy are two techniques which can be used together, and in 1930 Chandrasekhara V. Raman (pictured left) won the noble prize in physics. He discovered that radiation is scattered when a molecule is exposed to a frequency, v0, even though there is no change in frequency. This is called Rayleigh scattering, which is also responsible for the blue colour of the sky. A small amount of scattered radiation has frequencies of v0 ± v, where v is frequency of the vibrating section of the molecule. This is known as Raman scattering. It is actually quite an unsensitive because a only a small range actually undergoes Raman scattering. Improvements have been made by using Fourier transformation (FT) techniques.